By Jim Stack MSc PhD
The new report on abortions in Ireland is very short on information, but does allow us to compare the abortion rate of different counties. The figure for the total number of terminations in Ireland last year was, of course, 6666.
The measure of abortion rates used in this article is the abortion ratio, which is the number of abortions per year per 1000 live births.
Out of 6666 reported abortions in Ireland for 2019, 6059 had information about county of residence; in another 525 cases, the information about county was not provided, and the remainder were from outside the state, mostly Northern Ireland. (I will discuss the missing 525 cases at the end of this piece.)
Variation in abortion rates by province
In the RTE exit poll on the day of the 2018 abortion referendum, the highest percentage Yes vote was in Leinster (79.8% in Dublin, 67.2% rest of Leinster), then Munster (63.3%), then Connacht/Ulster (62%).
Actual abortion rates here in 2019 followed the same pattern. The abortion ratios for each of the four provinces, based on the 6059 cases for which county of residence was reported, were:
- 116.8 for Leinster (4023 abortions and 34,453 live births)
- 84.8 for Munster (1276 abortions and 15,044 births)
- 77.7 for Connacht (520 abortions and 6689 births) and
- 67.3 for Ulster (240 abortions and 3564 births).
These are quite substantial differences; in particular, the ratio for Leinster is nearly 75% higher than the ratio for Ulster.
Variation in abortion rates by county
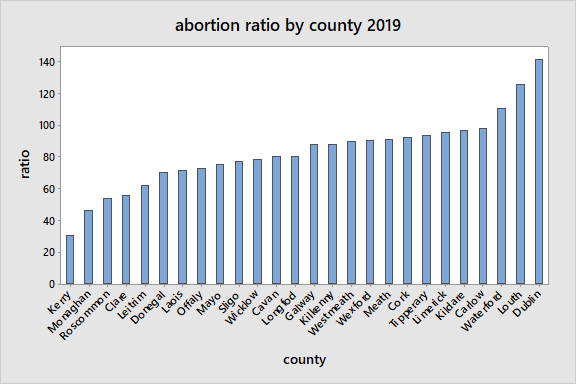
Results for each of the 26 counties (for the 6059 cases where county data were provided) are presented in Table 1. Counties in this table are listed alphabetically within province. In order to facilitate the comparison of individual counties, I also sorted the data in ascending order of abortion ratio, and I then used the sorted data to generate the bar chart shown in Figure 1.
Table 1: Births, abortions and abortion ratios by county
| Province | County | Live births | Number of abortions | Abortion ratio |
| Leinster | Carlow | 755 | 74 | 98.0 |
| Dublin | 17682 | 2493 | 141.0 | |
| Kildare | 3,067 | 295 | 96.2 | |
| Kilkenny | 1,094 | 96 | 87.8 | |
| Laois | 1,106 | 79 | 71.4 | |
| Longford | 586 | 47 | 80.2 | |
| Louth | 1,700 | 213 | 125.3 | |
| Meath | 2,771 | 252 | 90.9 | |
| Offaly | 924 | 67 | 72.5 | |
| Westmeath | 1,164 | 104 | 89.3 | |
| Wexford | 1,835 | 165 | 89.9 | |
| Wicklow | 1,769 | 138 | 78.0 | |
| Munster | Clare | 1,319 | 73 | 55.3 |
| Cork | 6,570 | 606 | 92.2 | |
| Kerry | 1,572 | 48 | 30.5 | |
| Limerick | 2,366 | 226 | 95.5 | |
| Tipperary | 1,864 | 174 | 93.3 | |
| Waterford | 1,353 | 149 | 110.1 | |
| Connacht | Galway | 3,198 | 280 | 87.6 |
| Leitrim | 438 | 27 | 61.6 | |
| Mayo | 1,481 | 111 | 74.9 | |
| Roscommon | 804 | 43 | 53.5 | |
| Sligo | 768 | 59 | 76.8 | |
| Ulster | Cavan | 962 | 77 | 80.0 |
| Donegal | 1,817 | 127 | 69.9 | |
| Monaghan | 785 | 36 | 45.9 |
Comparing individual counties
It is clear from Figure 1 that three counties (Dublin, Louth and Waterford) have abortion ratios well in excess of 100 (i.e. they have more than 1 abortion for every 10 live births). At the other extreme, Kerry’s abortion ratio of 30.5 (1 abortion for every 33 live births approximately) stands out as being extremely low compared with all other counties.
Monaghan, Roscommon, Clare, Leitrim and Donegal have the next lowest abortion ratios after Kerry, in the range 45 to 70. Neighbours Laois and Offaly come next (both low 70’s, the lowest in Leinster) and then neighbours Mayo and Sligo (75-77). Wicklow, Cavan and Longford are all close to 80.
The remaining ten counties have abortion ratios in the range 85-100.
Figure 1 Ranking counties by abortion ratio
 [1]
[1]
Departures from expected patterns
It is well-known, from abortion data in other countries, that abortion rates within countries tend to be much higher in areas of high population density. The Irish data certainly follow this pattern overall, with Dublin (population density 1458 persons per square kilometre, according to CSO) exhibiting the highest abortion ratio of 141.0, whereas the six counties with the lowest abortion ratios have low to medium population densities ranging from 33 to 57. The rank correlation, between abortion ratios and population density, is 0.655 (suggesting a reasonably strong relationship between abortion and density).
Nevertheless, there are some surprising deviations from this pattern in the Irish data. One would have expected that the counties close to Dublin, all with similar population densities, would also all have relatively high abortion ratios. While this is certainly true of Louth (125.3, second highest abortion ratio nationally), it is not at all true of Wicklow (abortion ratio of 78). Another major surprise is that counties Cork, Galway and Limerick, all with cities that are much larger than Waterford, should report abortion ratios in the range 87-96 whereas the Waterford ratio exceeds 110. Counties Cork (57 per sq km) and Waterford (59 per sq km) have very similar population densities; Galway (33 per sq km) and Limerick (47 per sq km) do have lower densities, however.
Discussion
There has been some coverage in Irish mainstream media about gaps in abortion provision in parts of the country. This media coverage has focussed mostly on hospitals rather than GP’s, whereas the vast bulk of the abortions here have been carried out by GP’s. The Irish Times, however, did report on December 31st 2019 that Co Sligo still did not have any abortion-providing GP’s on that date. Of note, the abortion ratio in Sligo in 2019 was higher than neighbouring counties Mayo, Leitrim and Donegal; in fact, there are nine counties in all with lower abortion ratios than Sligo. While there are myriad factors affecting abortion rates, it does not appear from this (admittedly brief) analysis that local availability of abortion provision should be numbered among them.
The large number of cases of missing data (525) is a cause of concern. Reported abortion ratios in the above analysis would have been higher if these 525 cases were not missing. For example, the 2493 abortions listed above for Dublin represent about 41% of all the listed abortions; if 41% of the 525 missing cases were also from Dublin, then the real figure for Dublin would be 216 more abortions than listed, and in that case the true abortion ratio would be 153.2. It is entirely possible, however that these missing cases are not distributed proportionately across counties. There may e.g. be less than 216 of the missing cases from Dublin, and proportionately more missing cases in some of the rural areas. If there is indeed a pattern of residence information being more likely to be withheld in the sparsely-populated counties, then abortions and abortion ratios for these counties are under-estimated in Table 1 above, relative to the other counties, and some of my conclusions here should change accordingly. The low abortion ratio for Kerry, for example, might be due in part to Kerry having a disproportionately high share of missing cases.
One final comment. While it is clear from the data presented here that regional support for abortion in the 2018 referendum is associated with higher reported abortion rates in this study, this relationship is less uniform at the county level than the provincial level e.g. Donegal was the only constituency in Ireland with a majority No vote in the referendum, but five other counties had lower abortion ratios than Donegal in the analysis above. Nevertheless, the overall picture that emerges here is that rural Ireland has lower abortion rates than urban Ireland, just as in the referendum of 2018 rural Ireland showed lower voter support for abortion than urban Ireland.
Jim Stack MSc PhD, a retired Mathematics Lecturer, has acted as statistical adviser/author on more than forty published, peer-reviewed medical studies (listed on the website PubMed [2] ). He writes here in a personal capacity.
The prompt and courteous assistance of the CSO is gratefully acknowledged. Their 2019 live birth data are provisional. The population density data quoted above are taken from Map 1.2 Population density region, 2016 [3] on the CSO website.